Winter 2026/27 in Europe: what a record El Niño can and cannot tell us
A post by Frank Kaspar (Head of Climate and Data Analytics at EUMETSAT) caught my eye this week. It points to a new EUMETSAT use case that looks at more than 30 years of satellite climate records and asks how European weather behaved during the strongest El Niño events [1]. Their conclusion for the coming months: if this El Niño behaves like the six strongest since 1991, January to March 2027 is likely to be warmer and wetter than normal in Europe, in line with the ECMWF seasonal forecast.
That is a big claim about a part of the world where El Niño is usually a weak player. So I went to the data myself: the ocean first, then 75 years of European winters, and finally the seasonal forecast that came out this month.
1. The ocean: an El Niño for the record books
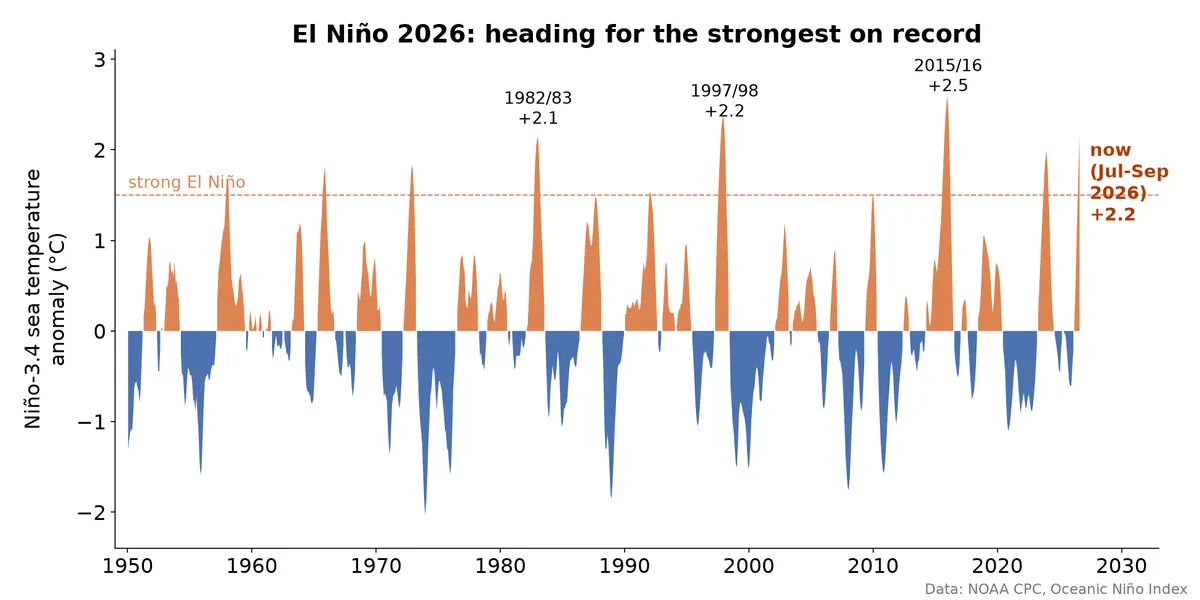 The Oceanic Niño Index since 1950, with the 1982/83, 1997/98 and 2015/16 peaks and the current value of +2.2 for July to September 2026
The Oceanic Niño Index (ONI) is the 3-month mean sea surface temperature anomaly in the central equatorial Pacific (Niño-3.4) [2]. For July to September 2026 it stands at +2.2 °C. No other El Niño was this warm at this time of year: 1997 was at +1.8 and 2015 at +1.7, and both went on to become the giants of the record, peaking at +2.4 and +2.6 in early winter.
NOAA's Climate Prediction Center (8 October) gives more than an 83% chance of a strong to very strong El Niño lasting through January to March 2027, and an 83% chance that October to December breaks the record of any El Niño since 1950 [3].
2. How does a warm Pacific reach Europe?
The chain goes like this: extra heat over the tropical Pacific makes deep thunderstorms shift east, which changes the Hadley and Walker circulations. That sends a train of Rossby waves north-east across the Pacific and North America, which nudges the jet stream and the storm track over the Atlantic [1, 4]. A second path runs through the stratosphere and can weaken the polar vortex in late winter [5].
The key word is nudges. By the time the signal reaches Europe it competes with everything else the atmosphere does, so the tropical signal is strong and the European one is weak. It tends to peak about six months after El Niño starts, in our winter [1].
3. What did past strong El Niño winters do?
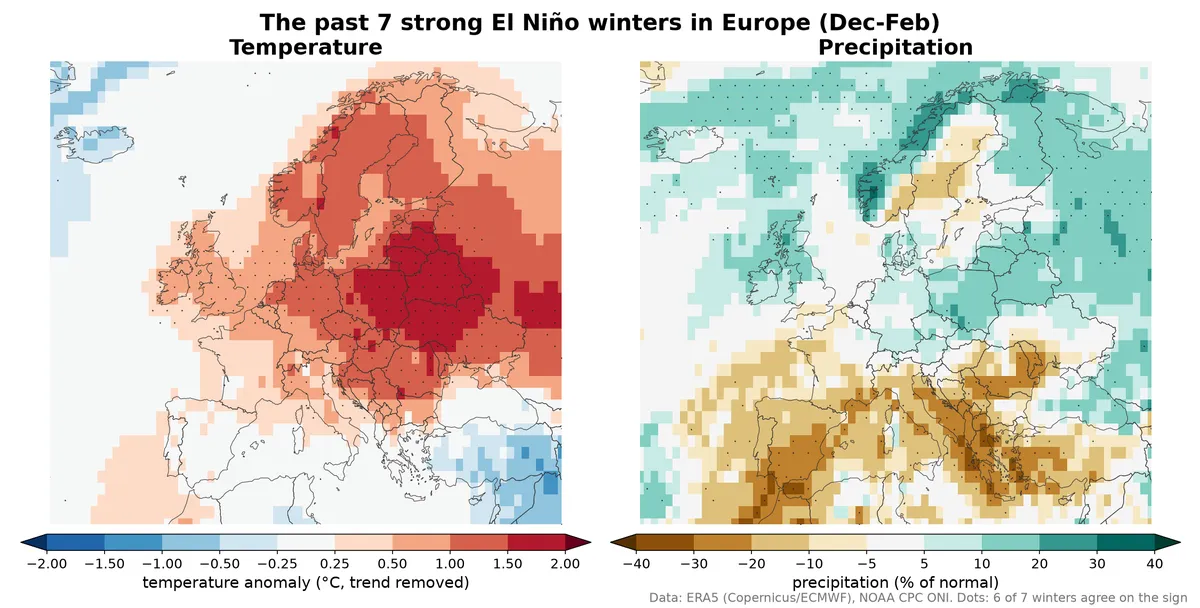 Average December to February temperature (trend removed) and precipitation anomalies in Europe over the seven strong El Niño winters since 1950, from ERA5
Since 1950, seven winters (December to February) had an ONI of +1.5 or more: 1957/58, 1972/73, 1982/83, 1991/92, 1997/98, 2015/16 and 2023/24. The map shows their average from ERA5 [6]. For temperature I removed each grid point's long-term trend first, so the map shows the El Niño signal and not the warming since the 1950s. Dots mark where at least six of the seven winters agree on the sign.
- Temperature: milder than the trend almost everywhere north of the Alps. The strongest signal is in central and eastern Europe (about +1.1 to +1.4 °C), with about +0.9 °C in Scandinavia and +0.5 °C in the British Isles.
- Precipitation: a north-south split. A little wetter in the north (about +5 to +7% in the British Isles, Scandinavia and central Europe) and clearly drier in the south (about -17% in Iberia, Italy and the Balkans).
This agrees with the EUMETSAT analysis for the north, but not entirely for the south: they used January to March and the satellite record since 1991, and got "warmer and wetter" for most of Europe [1]. Seven winters is a small sample, and the choice of months and years changes the picture.
4. The NAO does not take orders from El Niño
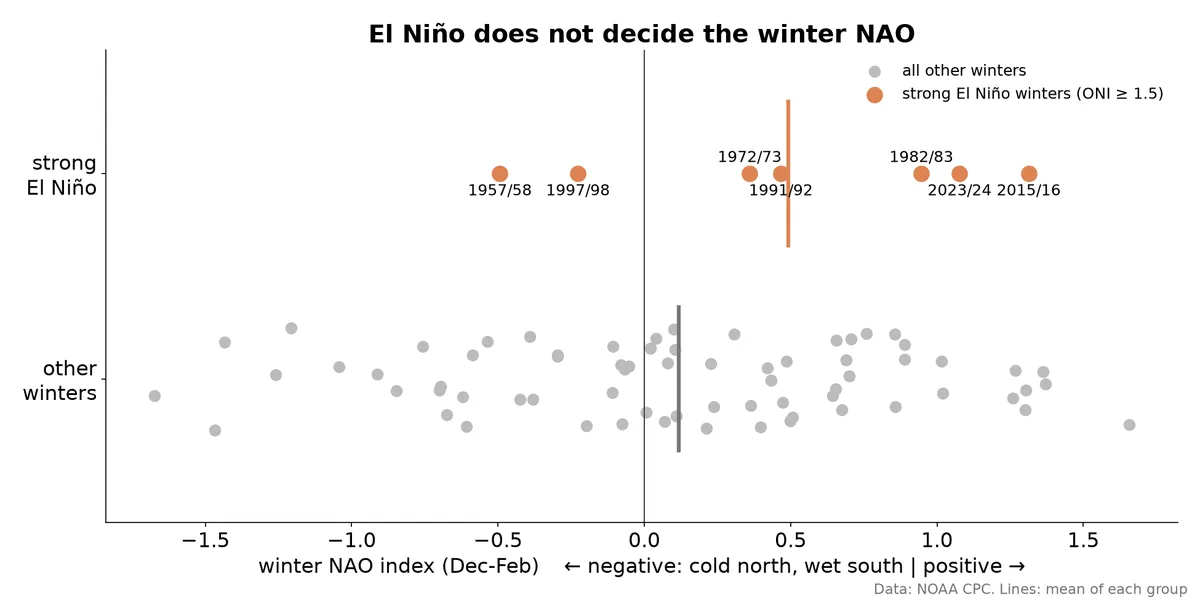 Winter NAO index for the seven strong El Niño winters compared with all other winters since 1951
The North Atlantic Oscillation (NAO) sets the tone of most European winters: positive means mild, wet and windy in the north; negative means cold in the north and wet in the south. Model studies suggest El Niño pushes the late-winter NAO towards negative [5].
The observations are less tidy. In five of the seven strong El Niño winters the December to February NAO was positive, and even for January to March it was positive in six of seven [7]. Only 1957/58 was clearly negative. Again, seven winters cannot settle the question either way. What they do show is that the NAO, which is mostly chaos, can easily drown the El Niño nudge.
5. ECMWF Seasonal Forecast (SEAS5) for December to February
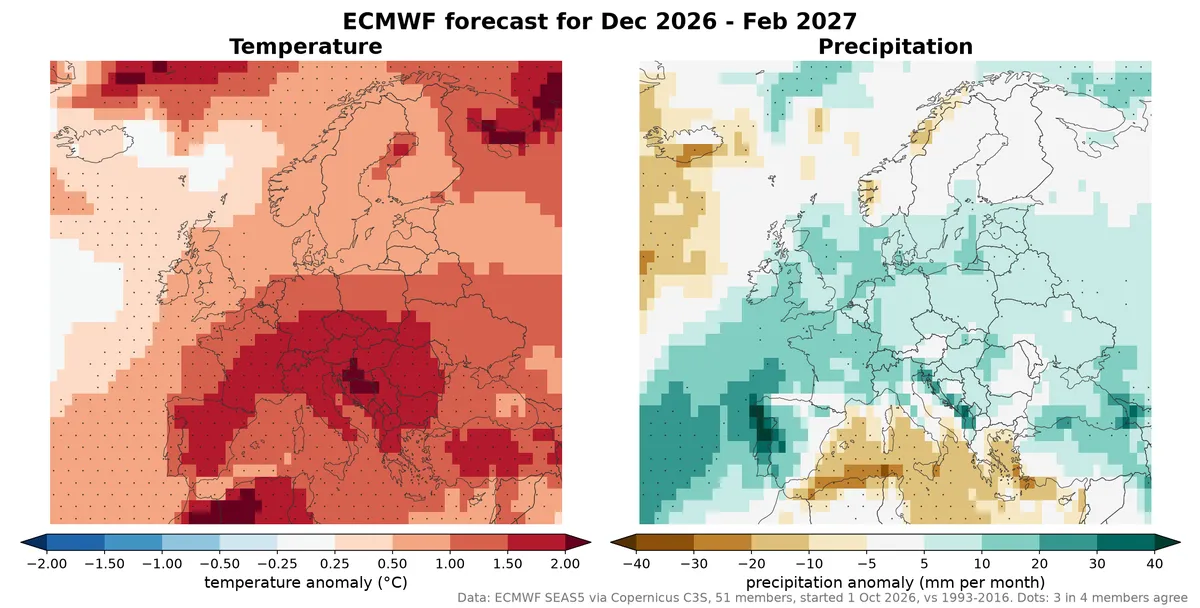
ECMWF SEAS5 ensemble mean temperature and precipitation anomalies for December 2026 to February 2027, started 1 October 2026
This is the ECMWF seasonal forecast (SEAS5) started on 1 October 2026, the average of 51 ensemble members for December to February, compared with the model's own 1993-2016 climate [8]. Dots mark where at least 3 in 4 members agree on the sign.
- Temperature: warmer than normal across the whole map. About +1.4 to +1.6 °C in Iberia, central Europe and the Mediterranean, +1.2 °C in eastern Europe, +0.8 °C in Scandinavia and +0.6 °C in the British Isles. The share of members that are warmer than normal goes from about 70% in Scandinavia and eastern Europe to 94% in Iberia.
- Precipitation: a wetter signal over western and central Europe (roughly +8 to +9 mm per month in France, the British Isles and central Europe) and drier around the southern Mediterranean. But only about 50 to 70% of the members agree, so this is close to a coin toss.
Two warnings. First, SEAS5's anomalies are against 1993-2016, so part of the warmth is simply climate change, not El Niño. Second, the spread is huge: averaged over eastern Europe, the members range from -6.5 °C to +5.7 °C. The ensemble mean hides cold members, and a cold month or two is still entirely possible.
Bottom line
- El Niño is on track to be among the strongest ever recorded, and it will peak this winter.
- Both the past El Niño winters and the ECMWF forecast tilt the odds towards a milder than normal winter, most clearly in central and eastern Europe.
- Precipitation is far less certain: maybe wetter in the north and west. The past winters suggest a drier south; the forecast does not.
- The NAO, and events like a sudden stratospheric warming, can still bring cold spells. Tilted odds are not a guarantee.
I will check back in December to see how the forecast is holding up.
References
- Roebeling, R. et al. (2026). Impact of El Niño Southern Oscillation on European climate: a satellite view. EUMETSAT case study, 5 October 2026. https://user.eumetsat.int/resources/case-studies/impact-of-el-nino-southern-oscillation-on-european-climate-a-satellite-view
- NOAA CPC, Oceanic Niño Index. https://www.cpc.ncep.noaa.gov/data/indices/oni.ascii.txt
- NOAA CPC, ENSO Diagnostic Discussion, 8 October 2026. https://www.cpc.ncep.noaa.gov/products/analysis_monitoring/enso_advisory/ensodisc.shtml
- Brönnimann, S. (2007). Impact of El Niño-Southern Oscillation on European climate. Rev. Geophys. 45, RG3003. https://doi.org/10.1029/2006RG000199
- Ineson, S. and Scaife, A. A. (2009). The role of the stratosphere in the European climate response to El Niño. Nat. Geosci. 2, 32-36. https://doi.org/10.1038/ngeo381
- Hersbach, H. et al. ERA5 monthly averaged data on single levels, Copernicus Climate Change Service (C3S) Climate Data Store. https://doi.org/10.24381/cds.f17050d7
- NOAA CPC, monthly NAO index. https://www.cpc.ncep.noaa.gov/products/precip/CWlink/pna/norm.nao.monthly.b5001.current.ascii
- Copernicus C3S, seasonal forecast anomalies on single levels (ECMWF SEAS5, system 51). https://cds.climate.copernicus.eu/datasets/seasonal-postprocessed-single-levels