Road temperature prediction modelling
Accurate estimates of the temperature at any specific location within a geographic area is a common challenge, especially when direct measurements are only available at a limited number of points.
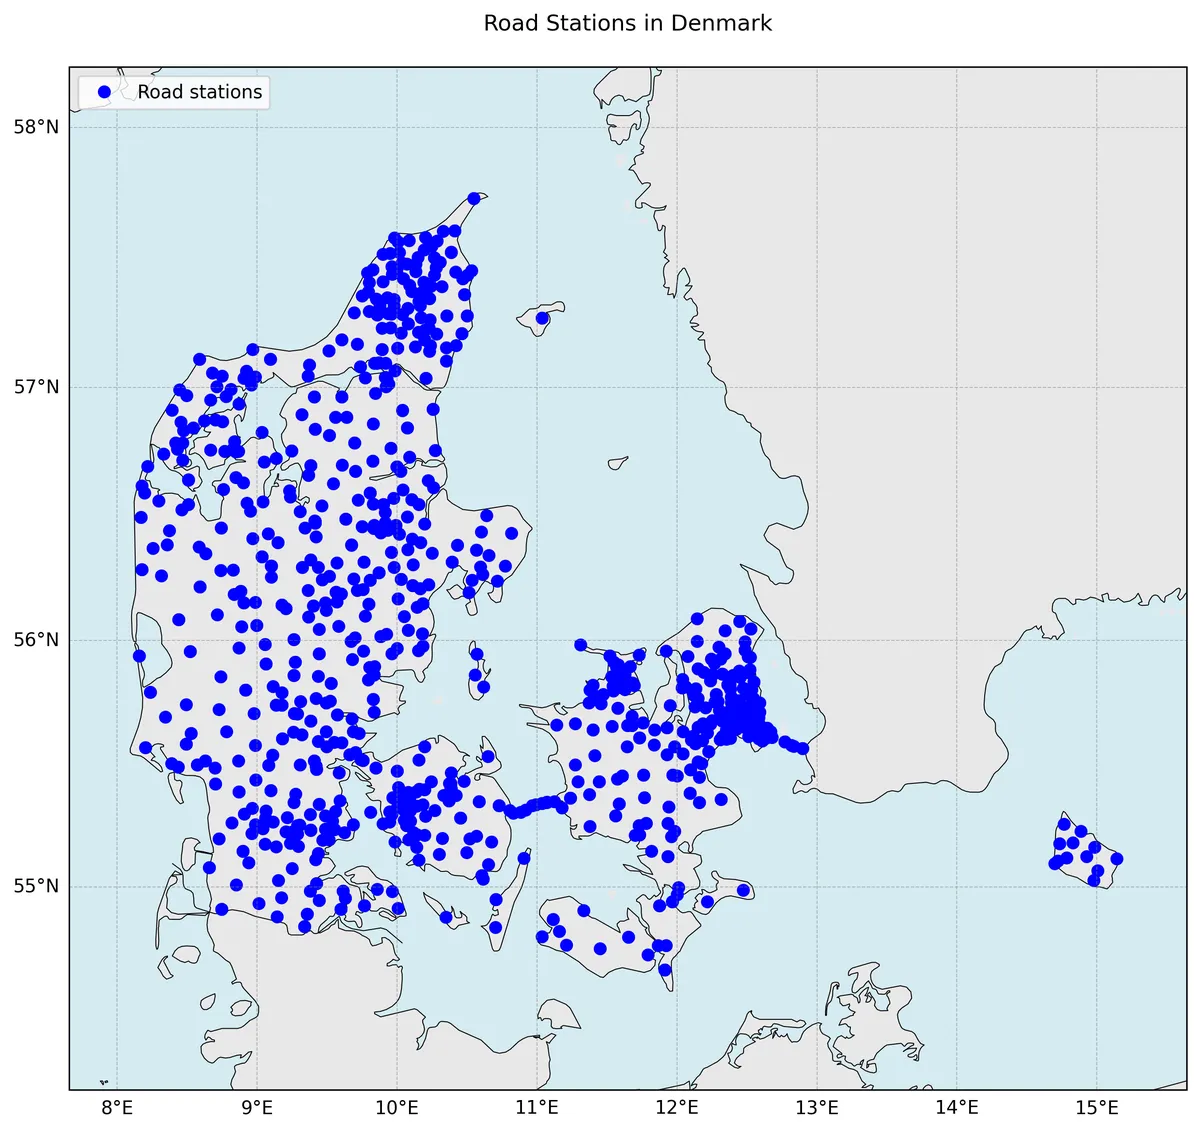
I have road temperature measurements collected from several locations across Denmark, as well as high-resolution orography information from a digital surface model (DSM) with a resolution as fine as 40 centimeters.
The central problem I aim to address is: How can I use geostatistical or machine learning models to predict the temperature at any given point within the domain, using both the available measurement data and detailed orographic features? The dataset I am working with is illustrated in the accompanying image.
There are several statistical and machine learning approaches that can be considered to tackle this problem.
Geostatistical Methods (Kriging) Kriging is a spatial interpolation technique widely used in geosciences. It predicts values at unmeasured locations based on the spatial autocorrelation of measured points.
Gaussian Process Regression (GPR). GPR is a machine learning method closely related to Kriging. It models the spatial correlation structure and can include additional features (e.g., elevation, slope, aspect from the DSM).
Random Forest Regression. Random Forests can be used to predict temperature using features such as latitude, longitude, elevation, slope, aspect, and other derived variables from the DSM.
Gradient Boosting Machines (e.g., XGBoost, LightGBM). Similar to Random Forests, but often more accurate and efficient. Spatial coordinates and DSM-derived features can be used as additional features.
Neural Networks (e.g., MLP, CNN). Since I have access to a very large dataset, covering several years of time series data, I could use neural networks. For gridded data, Convolutional Neural Networks (CNNs) are able to exploit spatial structures.
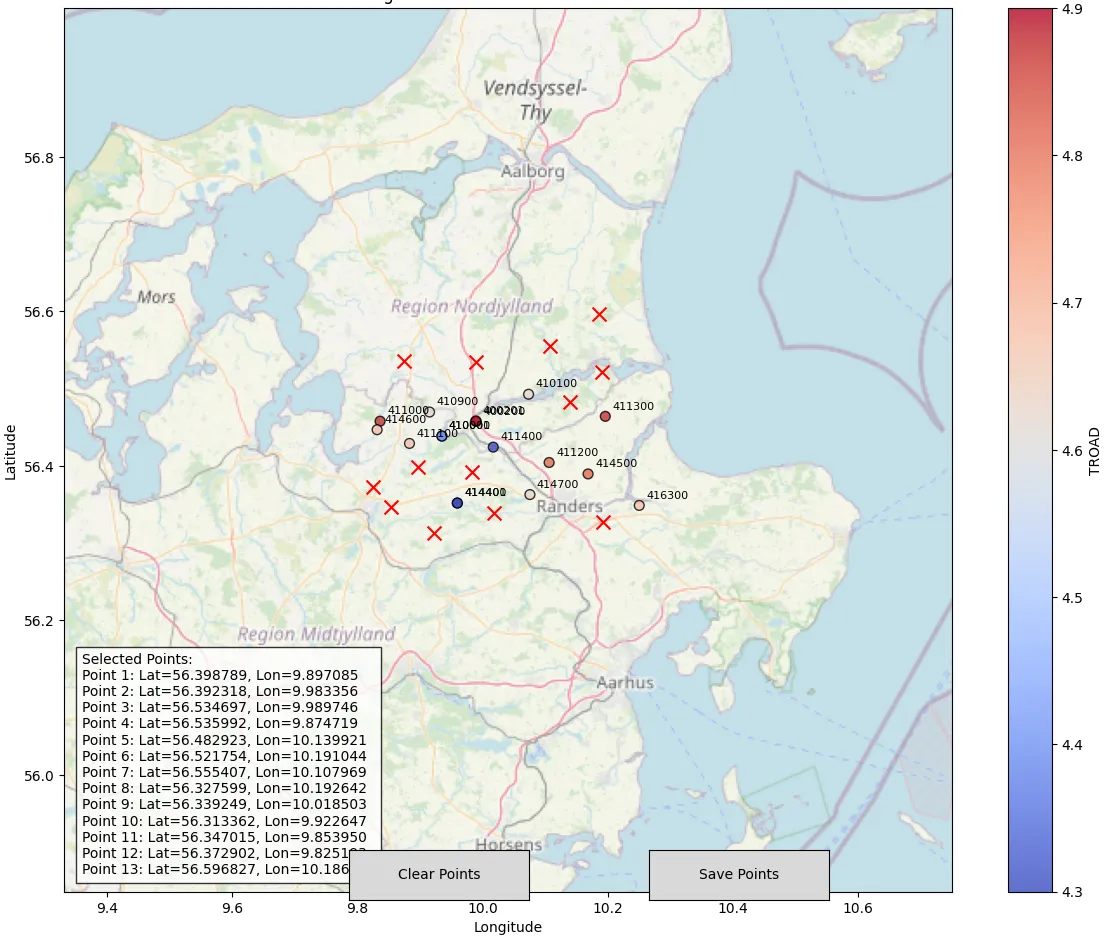
Since the actual data set is very dense, I will test some of the methods above on a small subset of the domain, shown below. The red crosses are the points where I want to calculate an estimate of the road temperature data using the data from the nearby stations (indicated by numbered circles). In this case I am looking at a day in early January at 2:00 am, so the temperatures are around 4 degrees Celsius. The plot is a snapshot of a python script I wrote to select the coordinates on the map, hence the "save" and "clear" points boxes.
I will be testing the simpler (stationary) approaches like kriging first, since they are computationally cheaper. I will report on my progress in a long series of posts.