Looking for the war in the weather
This post started with a chat with a friend. We were talking about wars and climate, and he threw a question at me: does the war in Ukraine change the weather, through the change in emissions that the conflict causes? And then, more to the point, how would you actually answer that? I didn't have a good answer, but I liked the second part of the question more than the first.
Most of my work is short-term forecasting, hours to days ahead, where the
atmosphere you start from matters more than almost anything else. Climate
projections are a different animal: decades instead of days, emissions
pathways instead of initial conditions, and big ensembles of climate models
that can disagree a lot with each other. I had used
CMIP6 data here and there, but never properly, so this looked like a good
excuse to sit down with it and get familiar with long-term projections.
I also have a strong interest in how we
model weather extremes, and lately I feel more and more pulled towards the
seasonal and longer timescales. It is hard not to be, when the influence of
climate change shows up so clearly in the short term, with one record
heatwave, flood or drought after another. The line between "weather" and
"climate" feels a lot thinner than it used to, and I wanted to understand the
long end of it better.
So I took my friend's question seriously and tried to answer it.
The Russian invasion of Ukraine shook up European energy. Coal came back for a
while when the gas stopped flowing, sanctions pushed some countries to speed
up their move away from fossil fuels, fertiliser trade out of the Black Sea
broke down, and a big chunk of Ukrainian farmland simply stopped being farmed.
All of those things touch the atmosphere in some way. More coal means more
CO2. Cutting sulphur emissions removes aerosols that were quietly cooling
things down. Less fertiliser on the fields means less ammonia going up. So the
question was whether any of that adds up to something you can see in the
weather over the Black Sea in the next fifteen years, and whether it matters
for the wheat that grows there.
Short answer: no. Or more precisely, it is there if you squint with a
hundred thousand samples, but it is so small compared to everything else that
it doesn't matter. This post is about how I got to that answer, including a
first attempt that got some of the numbers wrong, and why I think the
negative result is still worth writing about.
The setup
The region we considered is a box over the Black Sea, roughly 40 to 50°N and 25 to 45°E, which covers the Ukrainian chernozem belt, the southern Russian steppe, Romania and Bulgaria. That box produces something like 30% of the world's wheat exports in a normal year, so if anything there shifts, people in North Africa and the Middle East feel it in the bread price. I didn't run any climate model myself. I took monthly temperature and precipitation from the 14 CMIP6 models I could get data for, for 2025 to 2040, under SSP2-4.5, the "middle of the road" emissions pathway. I also repeated everything under SSP3-7.0, the "regional rivalry" one, which fits a world at war a bit better. On top of that I wrote four geopolitical scenarios, each one a small change relative to a no-conflict baseline:
- a prolonged conflict, with a European coal rebound (20 to 100 million tonnes of extra CO2 per year) and abandoned cropland,
- a trade fragmentation scenario, with fertiliser supply cut by 20 to 50%, which also means a bit less ammonia, and so fewer aerosols forming from it,
- an energy sanctions scenario, where Europe phases out fossil fuels faster, CO2 goes down a bit but the sulphur aerosols disappear and you get a small warming pulse,
- and a compound scenario, conflict plus trade breakdown together.
Every number in those scenarios came from somewhere (IEA, FAO, the IPCC aerosol tables, an IMF working paper on decoupling from Russian gas), and every one of them was a range rather than a single value. The CO2 and aerosol changes get turned into a regional temperature change with pattern scaling: a global warming from the change in forcing, times how much faster this region warms than the globe. The temperature and rain then go into a heat stress index and a drought index for the April to July grain filling period, which is when winter wheat is most sensitive. A damage function turns the stress into a yield loss.
Since every parameter is a range, I ran the whole chain as a Monte Carlo. For each model and scenario I drew the uncertain parameters 100 times (how much extra CO2, how sensitive the climate is, how much the region amplifies the global warming, and so on), and pushed the full 2025 to 2040 run through the chain for each draw. That is 14 models × 5 scenarios (the baseline plus the four above) × 100 draws × 16 years, or 112,000 yield numbers. Keep that number in mind, it comes back later.
The nudge is tiny
The first number that came out was the size of the warming nudge from the war. The coal rebound does essentially nothing: the extra warming over the region rounds to 0.000°C. Trade fragmentation and the compound scenario give about 0.01°C, from the small change in ammonia aerosols. The biggest one is the energy sanctions scenario, at about 0.09°C.
That last one surprised me a bit. The war scenario with the most warming is not the one burning more coal, it is the one cleaning up the air. Sulphur aerosols reflect sunlight and help make clouds brighter, so they have been hiding part of the warming for decades. Take them away quickly and you get that warming back, much faster than any change in CO2 can show up. It is the same effect people discussed after the 2020 rules on sulphur in shipping fuel, just smaller.
To get a feeling for what 0.09°C means, here is what the 14 models say the April to July temperature will look like over the region, as an anomaly against 1981 to 2010:
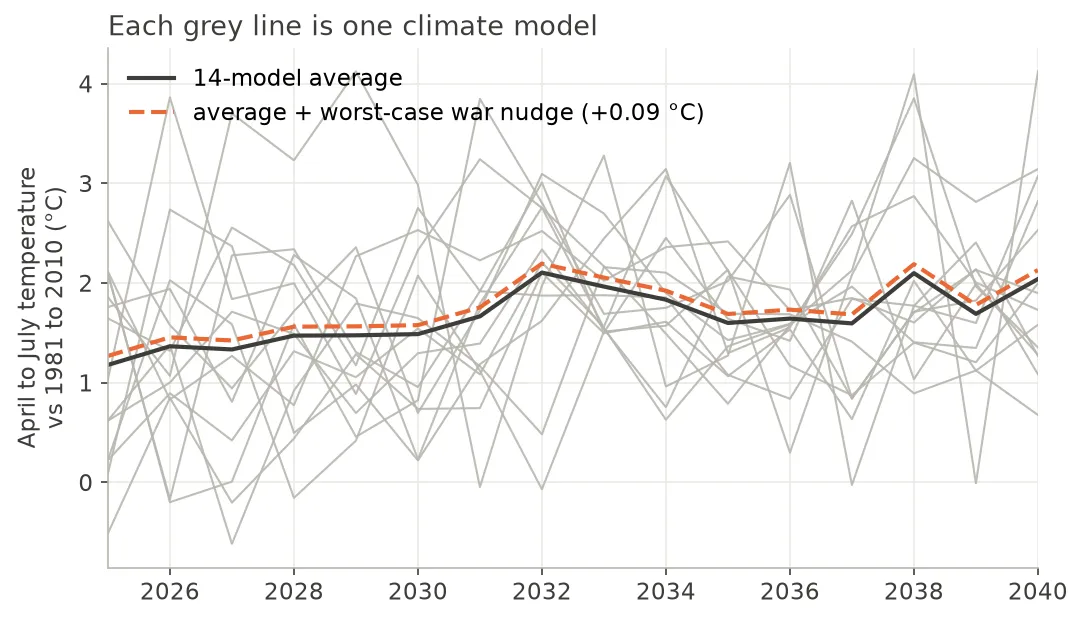 Each grey line is one CMIP6 model under SSP2-4.5. The black line is the
average, and the dashed orange line is the same average with the largest
war nudge (energy sanctions) added on top. You have to look closely to see
they are two lines.
The models agree that the region keeps warming, about 1.7°C above the 1981 to 2010 average on the 2025 to 2040 mean. But any single model swings by one or two degrees from one year to the next, and even when you average out the year to year noise, the models disagree with each other by about 0.3°C on the mean (one standard deviation). That is more than three times the biggest nudge I could get out of the war, and the year to year wiggles are ten to twenty times bigger. The orange line is basically sitting on top of the black one.
I got this wrong the first time
The first version of this analysis had different numbers, and I think the way they were wrong is worth telling. Going back through it, I found four problems:
- The extra CO2 was 30 to 80 times too high. I had written the coal rebound directly as 3 to 8 ppm of CO2, without converting from emissions. One ppm is about 7.8 billion tonnes of CO2, and only around half of what we emit stays in the air. Even an extra 100 million tonnes every year from 2025 to 2040, far more than the 2022 rebound, adds up to about 0.1 ppm.
- A rain cut nobody asked for. Each war scenario also took 3 to 12% off the rain, with no source behind it. A few hundredths of a degree of warming is worth a tenth of a percent of rain at most, and nobody knows the sign of even that over this region. So it went.
- Comparing against the wrong baseline. The conflict and trade scenarios ran on SSP3-7.0 and the baseline on SSP2-4.5, so part of the "war effect" was just the switch of emissions pathway. Now everything is compared on the same pathway.
- The war changed the past. The perturbation was applied to the whole record, including the 1981 to 2010 period the drought index is calibrated on. So the reference climate moved with the scenario and partly hid the signal. Now it starts in 2025.
The first three made the war look bigger, the last one smaller. After the fixes, the coal rebound dropped to nothing, and energy sanctions went up, because the oversized CO2 cut in that scenario had been cancelling most of the aerosol warming. The biggest climate effect of the war on yield went from 0.9 to 0.6 percentage points. Different numbers, same answer.
Statistically significant, practically nothing
The obvious next step was to test whether the scenarios are different from the baseline. I compared the yields of each scenario to the baseline with a t-test (does the mean move?) and a Kolmogorov-Smirnov test (does the whole distribution move?), with a Bonferroni correction since I was making four comparisons. In the first round, every single scenario came out as statistically significant, with p values below 0.001. If I had stopped there I could have written "geopolitical conflict significantly alters projected crop stress in the Black Sea" and it would have been technically true.
It would also have been nonsense, and the reason is the 112,000 from before. A p value answers a narrow question: if the war had exactly zero effect, how surprising would this difference be? With enough samples, any difference that is not exactly zero becomes surprising. And here I chose the number of samples myself. The 100 draws are not 100 new climates. Within each model the weather is the same 16 years every time, and only the parameters change between draws. On top of that, the baseline and the war scenario see exactly the same weather, so the difference between them is almost a constant offset with very little noise around it. The t statistics come out between 250 and 350. Had I run 1,000 draws instead of 100, the p values would have been even smaller, without the war doing anything different. The significance tells you more about my laptop than about the atmosphere.
There was a second trap in there. My first KS test was on the total yield, which includes the abandoned fields and the missing fertiliser, so of course it was significant. Testing the weather pathway alone, the prolonged conflict scenario isn't significant at all (p = 1). The others still are, for the reasons above.
The question that actually matters is how big the effect is, compared to the other things that move the answer. Through the weather, the war changes the yield by somewhere between nothing and 0.6 percentage points, depending on the scenario. The biggest other thing that moves the answer is which climate model you pick:
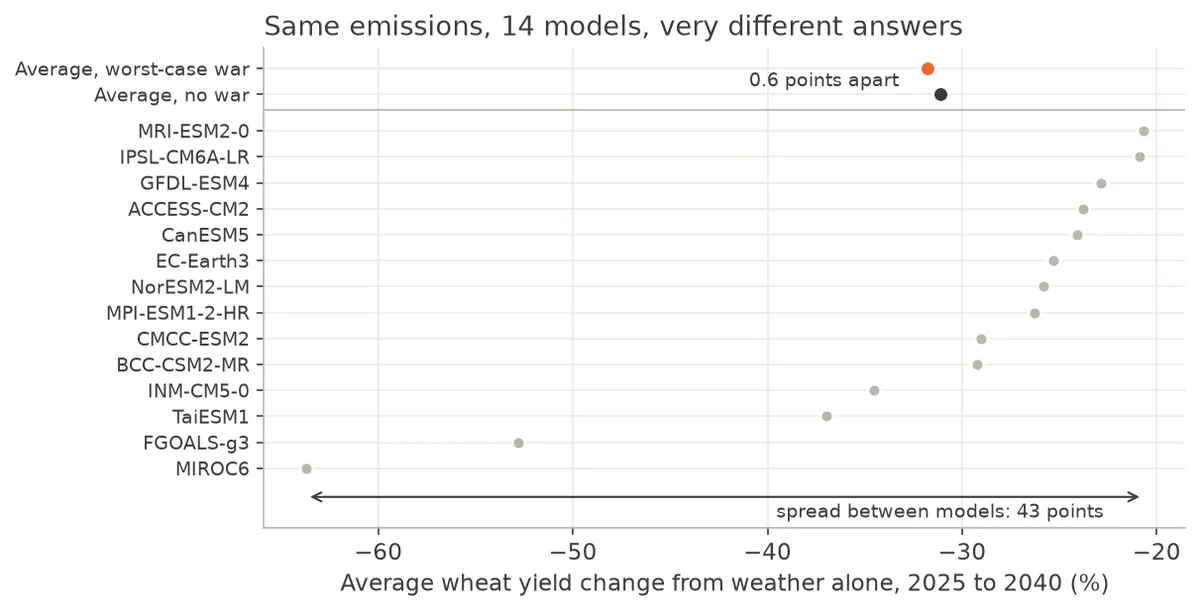 Average wheat yield change from the weather alone over 2025 to 2040, one
grey dot per model, all under SSP2-4.5. The top two rows are the average of
the 14 models, in black without the war and in orange with the war scenario
that has the largest climate effect. The arrow at the bottom shows how far apart
the models are.
The models go from around -21% (MRI-ESM2-0) to -64% (MIROC6), a spread of 43 percentage points, all with the same emissions. The war moves the average by 0.6 points at most. Picking a different climate model changes the answer by about seventy times more than the war does. Put another way, the biggest war effect is about 5% of one standard deviation of the spread between models. In the figure, the black and orange dots at the top sit almost on top of each other, while the grey dots cover most of the axis.
One caveat about the absolute numbers: they come out of my damage function, which is calibrated from the literature for Eastern European wheat and not fitted against observed Ukrainian yields, so I would not quote "-30%" to a farmer. What I trust is the relative picture, the size of the war effect next to the size of the model spread.
Other things that matter more than the war
The model spread is not the only thing that dwarfs the war. A few more came out along the way.
The first one is a lesson about the models themselves. You can split the total spread of the yield results into pieces: how much comes from the choice of model, how much from the scenario, how much from the uncertain parameters and how much from the year to year variability of the weather (the Hawkins and Sutton approach). My first attempt used only four models, the ones that were easy to download, and they all happened to sit in the moderate part of the CMIP6 range. With those four, model disagreement looked like 2.5% of the total. With fourteen it is about 45%. So the uncertainty I was trying to measure the war against was itself badly underestimated, just because of which models I happened to grab first. If you do impact work with three or four models, that is something to keep in mind.
The second is the emissions pathway. Running the baseline under SSP3-7.0 instead of SSP2-4.5 makes the climate yield loss only about 0.4 percentage points worse over this window, because the pathways have not really separated yet by 2040. That is the same size as the biggest war effect, which makes sense: both are small changes in forcing that haven't had time to build up.
The third is more of a methods thing. The damage function is curved: a bit of extra heat hurts more when it is already hot. So if you push a spread of climates through it and then average the losses, you get a bigger loss than if you average the climates first and compute the loss of the average. That is Jensen's inequality, if you want the name, and here it is worth about 1.5 percentage points of yield, more than twice the war's climate effect in any of the scenarios. Whether you average before or after computing the damage matters more than the thing I was looking for.
Where the war actually shows up
The climate channel was a dud, but the war obviously does hit wheat. It just doesn't do it through the sky. When I put the direct effects in, abandoned fields and missing fertiliser, the picture changes completely:
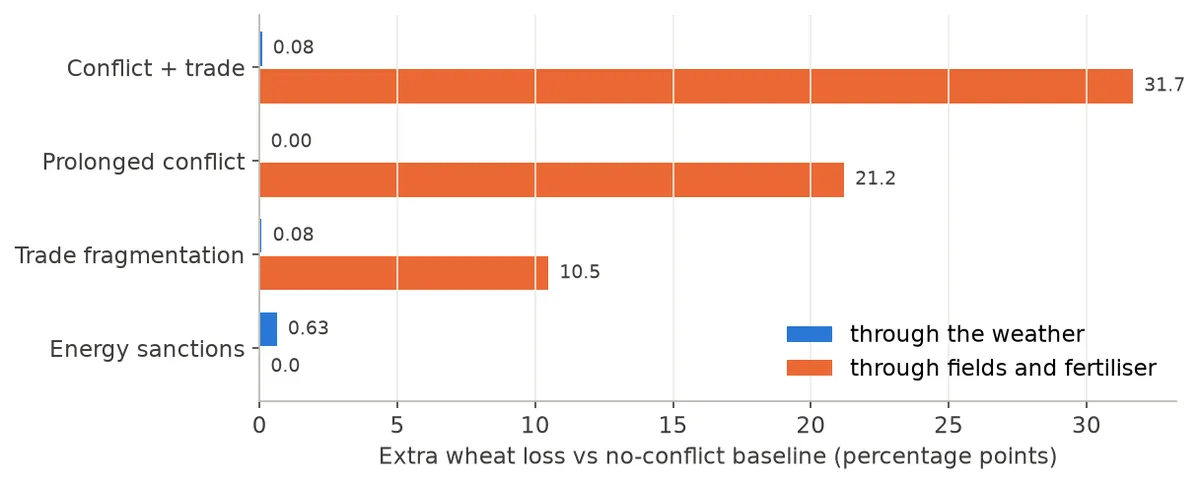
Extra wheat loss relative to the no-conflict baseline, split by how it arrives. Blue is what comes through temperature and rain, orange is what comes through land that is not farmed and fertiliser that doesn't arrive.
Abandoned cropland and the fertiliser deficit cost 10 to 32 percentage points of wheat, more than a hundred times what comes through the weather in the same scenarios. Strictly, abandoned fields are lost area rather than a lower yield per hectare, but for the amount of wheat that leaves the region it comes to the same thing. The energy sanctions scenario is the only one where the climate is the whole story, and there the total effect is 0.6 points, which is indistinguishable from the baseline for any practical purpose.
So if you care about food security after a war, the levers are mines in fields, fertiliser routes and shipping corridors. Climate adaptation in the region still matters, because the background warming keeps going whatever happens politically, but it is not the tool for this particular problem.
Why bother writing it up
I set out to find an effect and didn't find one, and part of me wanted to keep tuning things until something showed up. Push the regional amplification up, pick the scary end of every range, change the metric until the scenarios separate. I tried some of that, and the honest outcome is that no reasonable change in the climate side comes anywhere near closing a gap of a hundred times. The first version, with its oversized CO2 and its invented rain cut, was tilted in favour of the war, and it still came nowhere close. At some point you have to accept that the answer is "not at this scale".
I think the result is useful exactly because it is boring. The amounts of CO2 and aerosol that a regional war moves around are tiny compared to what the whole world emits, and fifteen years is too short for them to pile up into something the atmosphere notices above its own noise. The weather over the Black Sea in the 2030s will be decided by the global emissions trajectory and by which climate model turns out to be closer to the truth. The war will be felt in the fields, not in the forecast.
A few things I didn't do and that could change the details, if not the conclusion: the climate models are monthly and about 1° resolution, so nothing here says anything about individual heatwaves or local effects like smoke from burning fields; the pattern scaling is a first order approximation, and it is weakest exactly for aerosols, whose effects are regional rather than global, so the energy sanctions number could be off in either direction; the war's nudge is applied as a step from 2025, which overstates the CO2 part since CO2 builds up over time; and beyond 2040 the picture could look different, since the temperature departure from the wheat optimum keeps growing. I haven't run that yet.
So, back to my friend. Does a war change the weather? Not in any way you could pick out over the next fifteen years. How would I answer it? More or less like this, and it took a lot longer than the question did. I got a much better feel for CMIP6 out of it, for how wide the spread between climate models really is, for how easy it is to call something "significant" when it isn't, and for checking the arithmetic before running the Monte Carlo.
References
- Burke, M., Hsiang, S. M., & Miguel, E. (2015). Global non-linear effect of temperature on economic production. Nature, 527, 235-239.
- Ember (2023). European Electricity Review 2023.
- FAO GIEWS (2022-2024). Country briefs and crop monitor reports for Ukraine.
- FAO (2023). World Fertilizer Trends and Outlook.
- Hawkins, E., & Sutton, R. (2009). The potential to narrow uncertainty in regional climate predictions. Bulletin of the American Meteorological Society, 90(8), 1095-1107.
- IEA (2023). World Energy Outlook 2023.
- IPCC (2021). Climate Change 2021: The Physical Science Basis. Working Group I contribution to the Sixth Assessment Report, Chapters 5, 6 and 7.
- Lassaletta, L., et al. (2016). Nitrogen use in the global food system. Environmental Research Letters, 11, 095007.
- Rojas-Romagosa, H. (2024). Medium-term macroeconomic effects of Russia's war in Ukraine and how it affects energy security and global emission targets. IMF Working Paper WP/24/39.
- Vicente-Serrano, S. M., Beguería, S., & López-Moreno, J. I. (2010). A multiscalar drought index sensitive to global warming: the Standardized Precipitation Evapotranspiration Index. Journal of Climate, 23(7), 1696-1718.
- Eyring, V., et al. (2016). Overview of the Coupled Model Intercomparison Project Phase 6 (CMIP6). Geoscientific Model Development, 9, 1937-1958.