Large scale circulation patterns and seasonal weather: NOA
I recently heard an interesting comment on the reliability of seasonal weather forecasts from someone who works on energy trading. People working on energy trading need to have an idea of what to expect on the short (hours to days) or long (weeks to months) time horizon to make bets on the price of energy. This is pretty important in the winter months, since energy usage usually increases during this time of the year.
One of the typical ways trading meteorologists attempt to make predictions on the seasonal scale is by looking at teleconnections between global atmospheric circulation patterns like the quasi biennial oscillation, the polar vortex, sudden stratospheric Warming (SSW) events, or La Nina/El Nino (ENSO), etc, and seasonal weather. My colleague pointed out that it is extremely hard to make predictions on these time frames, especially in Europe, because the correlation between such patterns and local weather events is quite poor, and most of the time the signal is very noisy.
Having said that, there are some rough indicators of these kind of long (seasonal) trends. I will start a series of posts describing these weather patterns in some detail.
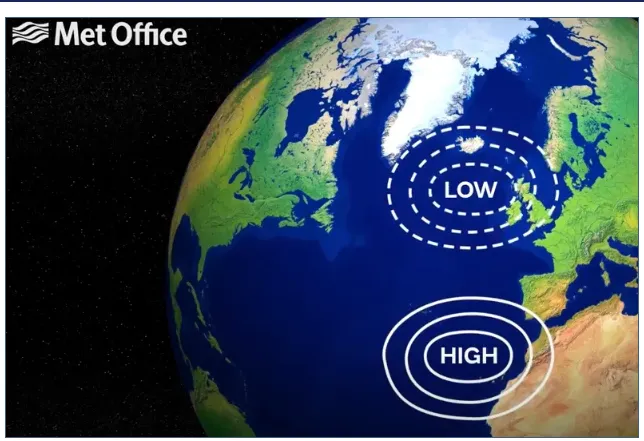
In Northern Europe, one of the most well-known drivers of winter weather is the North Atlantic Oscillation (NAO). This is a large scale weather pattern that rises from fluctuations in the difference of atmospheric pressure at sea level between the "Icelandic Low" (a pattern of low atmospheric pressure found between Iceland and southern Greenland) and the "Azores High" (a centre of atmospheric pressure found south of the Azores in the Atlantic Ocean). Schematically, these two atmospheric pressure systems look like this
It has two "phases" or variations in atmospheric pressure: a positive and and a negative one. As seen in this nice image from wikipedia, the two phases have a distinctive imprint in the sea level surface pressure over the northern latitudes:
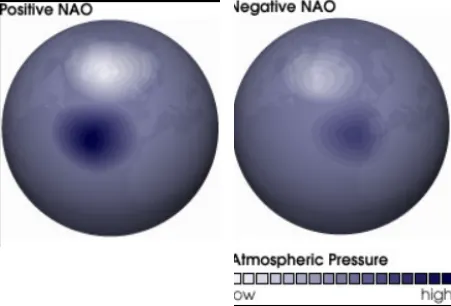
When the NAO is positive, the pressure difference between the Icelandic Low and the Azores high is greater than normal (normal here meaning a long term average, see below for a more quantitative description). A positive NAO leads to a stronger westerly flow into Western Europe. The positive phase is associated with mild winters. When the NAO is positive, the stronger than normal low pressure (trough) over Greenland allows colder air to sweep eastward across Canada and into the northern Atlantic, keeping conditions milder all the way from eastern North America to western areas of Europe.
A negative NAO corresponds to a lower than normal pressure (ridge) forming over Greenland (the "Greenland Block"), which leads to colder Arctic air sweeps southward into both eastern North America and into much of Europe, leading to a cold winter.
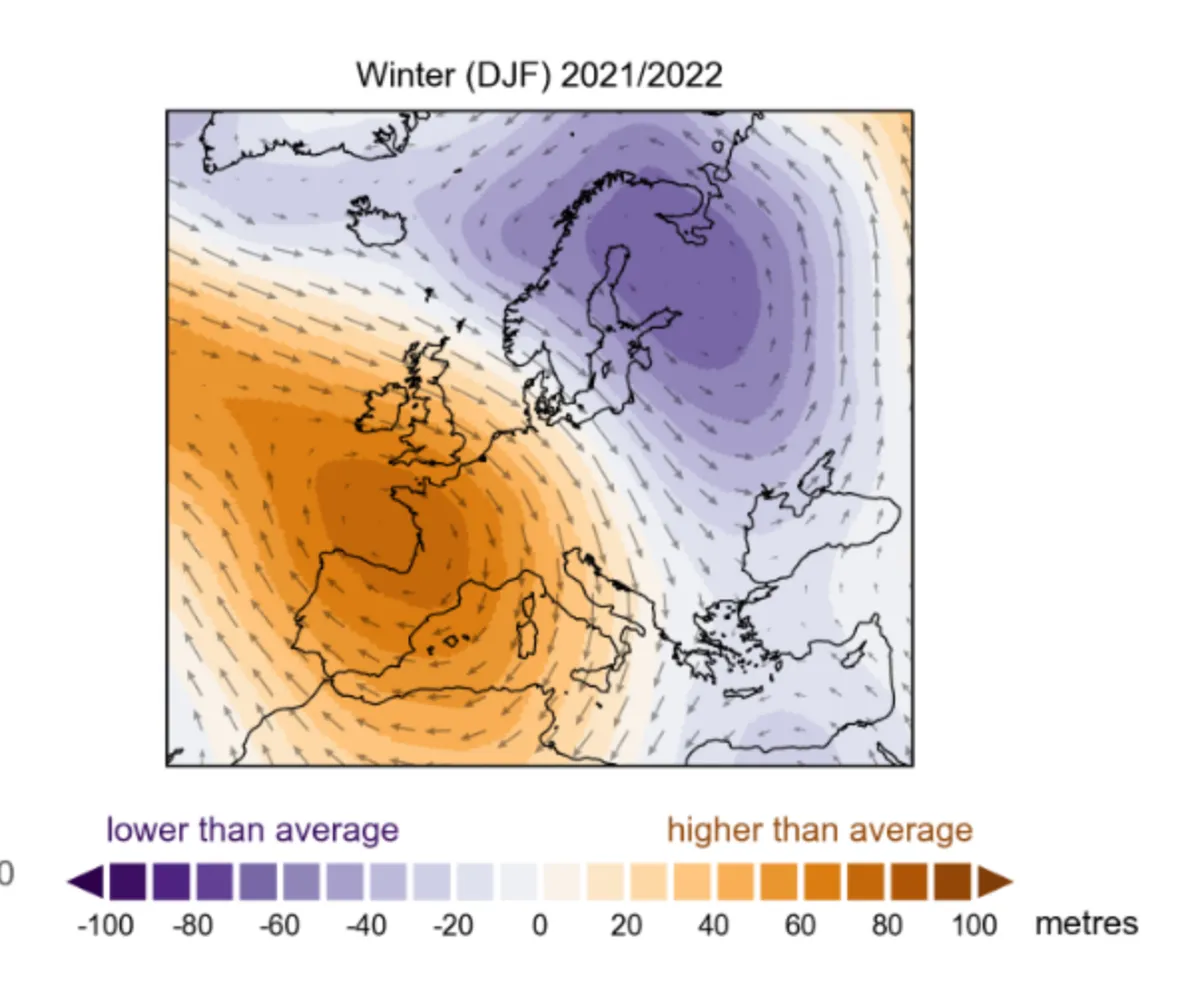
These effects can be visualized more clearly by plotting the 500 hPa geopotential anomaly (ie, the difference between geopotential height and long-term average for a reference period). An example of this can be seen for the winter of 2022, using the 1991-2020 as reference period for the long-term average. By convention, positive anomalies are plotted in red and negative anomalies are plotted in blue.
 Source: CDS
During the 2021/2022 positive anomalies over western Europe led to dry and warmer than average conditions while the negative anomalies over Scandinavia and eastern Europe produced colder- and wetter-than-average conditions.
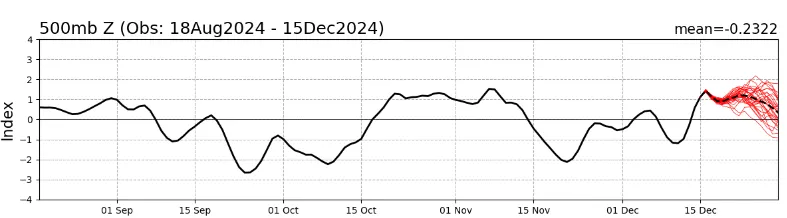
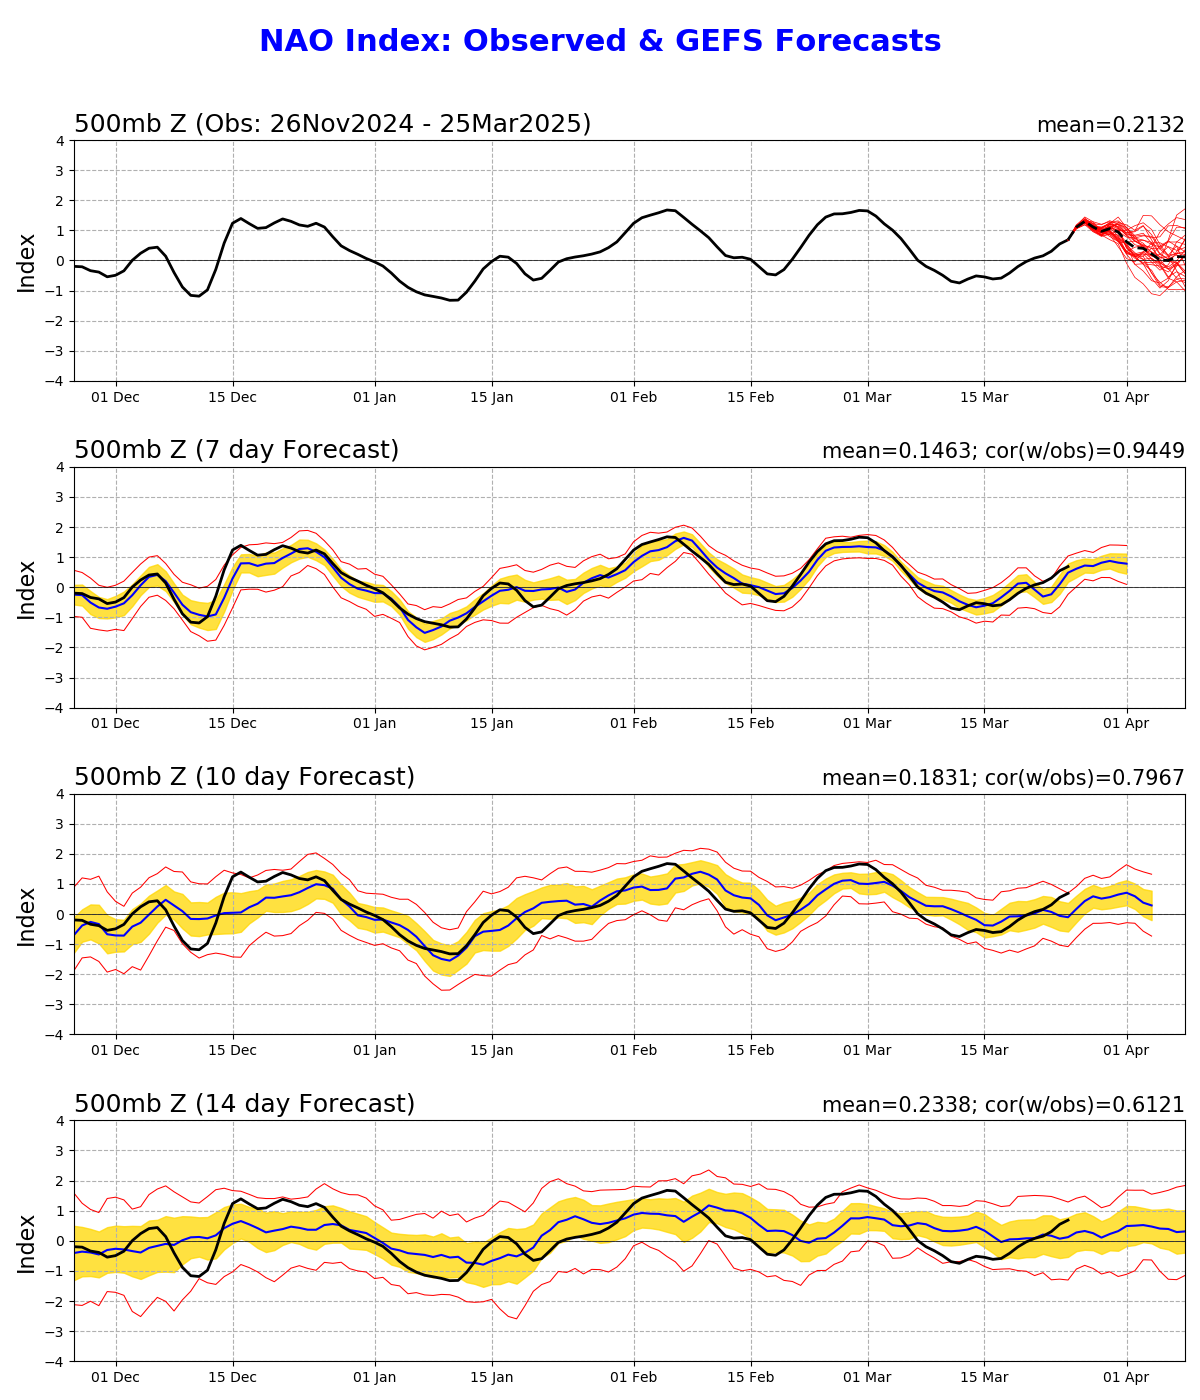
Probably the simplest way to visualize these changes is using the NOA index, which is the normalized pressure difference between weather station data in Gibraltar and SW Iceland. Time series of NOA indices are routinely calculated by weather services. One good source of such data is NOAA. This plot shows monthly averages of the NOA index.
 Source: NOAA
As the plot shows, we have currently entered a positive NAO phase, so we should expect milder conditions.