Is the polar vortex breaking up in november?
My feeds have been full of the polar vortex this week. Weather accounts post maps of a swirl over the Arctic tearing in two, with captions about the "earliest sudden stratospheric warming on record". Scientists post more careful versions of the same maps. Then the question comes from friends and family: does this mean a cold winter?
I work on short-range forecasting, so the stratosphere is not my usual territory. Still, this is one of the few links we have between what happens 30 km up and the weather on the ground weeks later, and this year it is happening at a very odd time. So I sat down to work out what is going on, what is actually new about it, and what we can and cannot say about the winter.
What the polar vortex is
Every autumn the Arctic loses the sun. The stratosphere over the pole, roughly 15 to 50 km up, cools fast, and the temperature difference between the pole and the mid-latitudes drives a ring of strong westerly winds around it. That ring and the cold air inside it is the stratospheric polar vortex. It normally gets stronger through November and December and peaks in midwinter.
It is not alone up there. Large-scale waves from the troposphere, made by air flowing over mountain ranges like the Rockies and the Himalayas and by the contrast between land and sea, propagate upward. When enough wave energy reaches the stratosphere it can slow the vortex down, push it off the pole (a displacement) or pinch it into two pieces (a split). When the disruption is strong enough to reverse the winds, so the zonal-mean wind at 60°N and 10 hPa (about 30 km) turns from westerly to easterly, we call it a major sudden stratospheric warming (SSW) [1]. The "warming" part is real: the air inside the old vortex sinks and compresses, and stratospheric temperatures can rise by tens of degrees in a few days.
Major SSWs happen about six times per decade in the Northern Hemisphere, and almost all of them happen between late December and March [2, 3]. That is the key to why this one is getting attention.
What is happening right now
The version going around social media is roughly right: winds slowing hard, a split with lobes over Siberia and North America, and 10 hPa temperatures forecast up to 22°C (40°F) above normal [4]. What tends to get lost when it is shared are the caveats.
I wanted to see it for myself, so I pulled the 10 hPa fields from NOAA's GFS model, which are free to download [5]. Here is the vortex as seen from above the North Pole, in the analysis for this morning and in the forecast for a week from now:
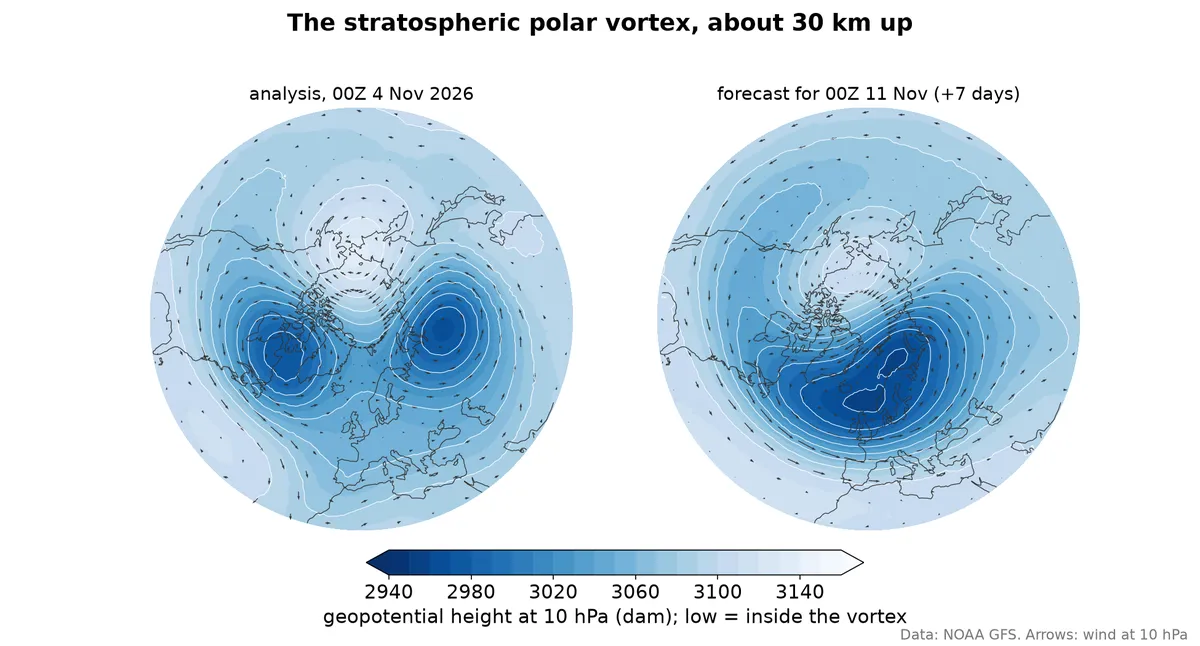 Geopotential height and winds at 10 hPa, about 30 km up. Low heights (dark)
are the inside of the vortex. Left: GFS analysis, 00Z 4 November 2026. Right:
GFS forecast for 00Z 11 November. Europe is at the bottom, North America to
the left, Siberia to the right.
A healthy vortex in November is one round low centred close to the pole, with a strong ring of westerly winds around it. This morning there are two lows, one over northern Canada and one over Siberia, with high pressure sitting on the pole between them and each lobe spinning on its own. At this level and on this day, the vortex is split.
The right panel is the part I find more interesting. In a week, the GFS merges the pieces back into a single vortex, but not over the pole: it sits over Scandinavia and northern Russia, pushed off the pole by a ridge over the Pacific side. That is a displaced vortex. It matches what Judah Cohen writes in his AER blog from 2 November [6]: he calls the current state a stretched vortex rather than a split, and expects it to turn into a displacement-type SSW as the wave-1 pattern takes over from wave-2. A split on one map at one time is not the same as a split SSW in the classification sense, which looks at the geometry over several levels and days around the date the winds reverse.
A prediction, not an observation yet
The formal test is the zonal-mean wind at 60°N and 10 hPa, so I computed it. The grey bands below are the 1979-2025 climatology from ERA5 [7], the red line is this autumn up to today (ERA5, then the GFS analyses for the last few days, which ERA5 has not caught up with yet), and the blue lines are the 31 members of NOAA's GEFS ensemble from this morning's run.
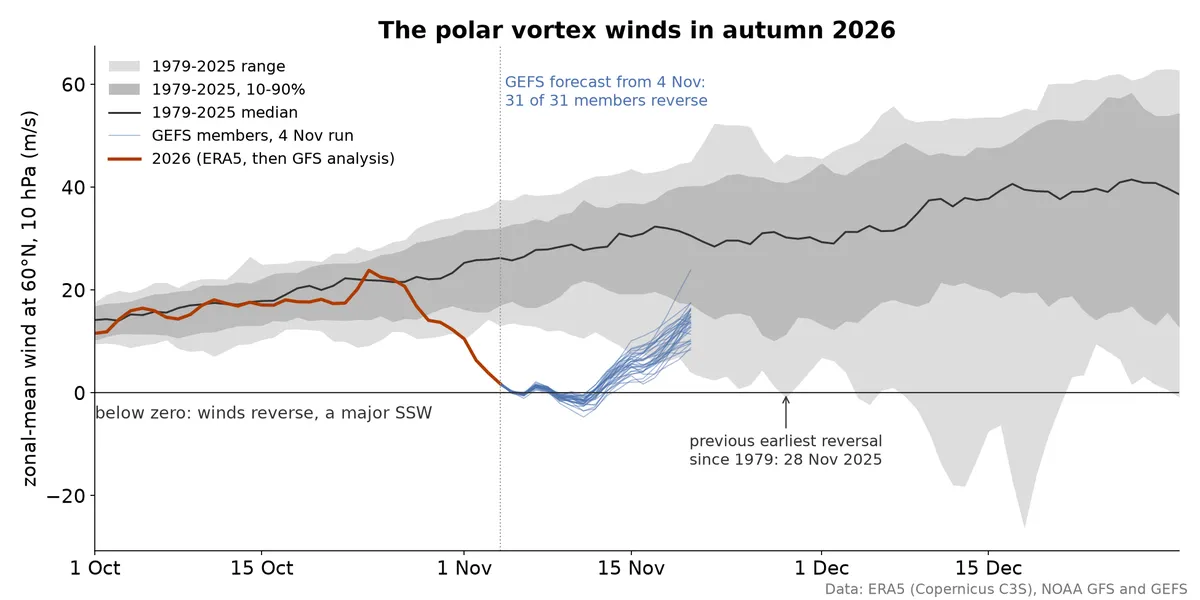 Zonal-mean zonal wind at 60°N, 10 hPa. Grey: ERA5 1979-2025, daily at
00 UTC. Red: 2026, ERA5 to 30 October, then GFS analyses. Blue: the 31 GEFS
members from the 00Z 4 November run, out to 16 days.
The wind was right at the climatological median until late October, then dropped from about 24 m/s to below 2 m/s in ten days, falling out of the bottom of the 1979-2025 range. It has not reversed yet. It is forecast to: all 31 GEFS members cross zero, 26 of them on 6 November, with a shallow minimum around -2 m/s near 11 November before the winds pick up again. Other centres agree. In the runs from late October, the ECMWF ensemble gave a 96% chance of a reversal by 11 November, with the GEFS at 71% and ECMWF's AI model (AIFS) at 37% at that time [4]. Cohen writes that "all models including the GFS are predicting the earliest SSW on record over the next two weeks", while noting that the date keeps slipping and the event may arrive in parts [6].
So everything in this post about the SSW itself is a forecast, made a couple of days before the event, by models that are generally good at this. Two things in the forecast are worth noticing. The reversal is weak, only a few m/s below zero, while big midwinter events go to -20 m/s or more. And the recovery is quick: by 20 November all members are back to westerlies, though still well below normal.
Why the date matters
In ERA5 the earliest autumn reversal since 1979 is 28 November 2025, last year. Older records list one on a similar date in 1968 [1, 2]. A reversal on 6 November would beat both by about three weeks. That is a lot, given how strong the seasonal cycle is at this time of year: the vortex is supposed to be spinning up fast as the polar night sets in, and it takes an unusual amount of wave forcing to knock it over this early.
Part of the explanation is probably the background state. We are in a strong El Niño, and El Niño winters tend to have a weaker, more disturbed vortex, because they deepen the Aleutian low (the semi-permanent area of low pressure over the North Pacific, strongest in winter) and boost the upward wave flux from the North Pacific [8]. That makes a disruption more likely in general. It does not explain why it happened in early November in particular.
What an SSW usually does to the weather below
The reason forecasters care is what comes next. After roughly two thirds of major SSWs, the circulation anomaly works its way down into the troposphere over the following weeks. The signature at the surface is a negative Arctic Oscillation and a negative North Atlantic Oscillation: the jet stream weakens and meanders more, blocking highs become more frequent, and cold air that is normally held over the Arctic leaks south. The classic impacts are cold spells in northern and western Europe and in the eastern US, and milder conditions in places like Greenland and eastern Canada. The descent typically takes one to four weeks, and the effects can last for one to two months [9].
That is the average, and the averages are built from midwinter events. Here is where it gets less certain for this one:
- Not every SSW couples down. About a third of them stay in the stratosphere and make no clear mark on the surface. We cannot tell in advance with much confidence which kind we are getting.
- There is almost no history for November events. The composites behind "SSW means cold Europe" come from December to March. In November the troposphere is in a different state, and Arctic cold reservoirs are still building. In North America, for example, northern Canada is not yet cold enough to supply a real Arctic outbreak.
- The vortex has a whole winter to recover. An early SSW does not mean a weak vortex until spring. The vortex can rebuild in December, with the sun still gone, and then be disturbed again, or not. Cohen calls this "a marathon and not a sprint" [6].
- El Niño pulls in its own direction. Strong El Niño winters tend to be mild over northern North America and favour a wet, stormy southern US. For Europe the El Niño signal is weak and comes mostly late in the winter [8]. Untangling what is the SSW and what is El Niño will be hard even after the fact.
- The expected pathway has been unreliable lately. Cohen goes further and writes that "the SSW-AO pathway is broken", with the classic surface response often failing to show up since 2009/10. He still thinks the SSW "is almost certainly going to increase the likelihood of severe winter weather" somewhere in the Northern Hemisphere, but with "very low confidence" on where [6].
A cold winter?
What the forecasts say for the next two weeks is not dramatic. The AER blog from 2 November [6] has normal to below normal temperatures over central and southern Europe this week, then normal to above normal for most of Europe next week, and a turn to "widespread normal to below normal temperatures across much of Europe including the UK" in week two. North America looks mostly mild for the next two weeks, apart from the West Coast and northern Quebec. The surface AO is forecast near neutral to slightly negative. Cohen's preferred analog is November 2009, the start of a winter that was very cold in northern Europe, with December 1997 and January 2016 as alternatives, which ended up very different. That spread is itself the message.
My reading, as someone outside the stratosphere community:
- The event is real and genuinely unusual. The vortex is already split at 10 hPa, and every GEFS member predicts a formal wind reversal around 6 November. It is forecast to be weak and short, though.
- It shifts the odds towards a more blocked, more meandering pattern in the second half of November and into December, which in our part of the world (Scandinavia, northern and central Europe) means a higher chance of cold spells. Higher chance, not a forecast of cold.
- It says much less about January to March. That depends on whether the vortex recovers and on El Niño, and nobody has a good handle on either yet.
The pattern with SSW news is always the same. The stratospheric event gets forecast well and weeks in advance, which is remarkable on its own. The surface consequences get reported with the same confidence, and they do not deserve it. The honest headline is less exciting: the polar vortex is doing something it has never been seen to do in November, and the weather under it for the next six weeks is a bit more likely than usual to be interesting.
References
- Charlton, A. J. and Polvani, L. M. (2007). A new look at stratospheric sudden warmings. Part I: Climatology and modeling benchmarks. J. Climate 20, 449-469. https://doi.org/10.1175/JCLI3996.1
- Butler, A. H. et al. (2017). A sudden stratospheric warming compendium. Earth Syst. Sci. Data 9, 63-76. https://doi.org/10.5194/essd-9-63-2017
- Philadelphia Inquirer, 30 October 2026, with comments from Laura Ciasto (NWS) and Judah Cohen. https://www.inquirer.com/weather/polar-vortex-stratospheric-warming-philadelphia-weather-20261030.html
- severe-weather.eu (28 October 2026). Polar Vortex Split Forecast: The Earliest Stratospheric Warming on Record Is Coming. https://www.severe-weather.eu/global-weather/polar-vortex-split-record-early-stratospheric-warming-event-november-2026-united-states-canada-europe-fa/
- NOAA Open Data Dissemination, GFS and GEFS on AWS. https://registry.opendata.aws/noaa-gfs-bdp-pds/, https://registry.opendata.aws/noaa-gefs/
- Cohen, J. (2 November 2026). Arctic Oscillation and Polar Vortex Analysis and Forecasts. AER. https://published.aer.com/aoblog/aoblog.html
- Hersbach, H. et al. (2020). The ERA5 global reanalysis. Q. J. R. Meteorol. Soc. 146, 1999-2049. https://doi.org/10.1002/qj.3803. Data: ERA5 hourly data on pressure levels, Copernicus C3S CDS. https://doi.org/10.24381/cds.bd0915c6
- Domeisen, D. I. V., Garfinkel, C. I. and Butler, A. H. (2019). The teleconnection of El Niño Southern Oscillation to the stratosphere. Rev. Geophys. 57, 5-47. https://doi.org/10.1029/2018RG000596
- Baldwin, M. P. et al. (2021). Sudden stratospheric warmings. Rev. Geophys. 59, e2020RG000708. https://doi.org/10.1029/2020RG000708