Dunkelflaute: the weather pattern behind two dark, still weeks in Europe
German has a word for the weather much of northern Europe has had since the end of October: dunkelflaute. Dunkel is dark, and Flaute is the sailor's word for a dead calm, the kind of day when a sailing ship goes nowhere. Put together it means a spell of grey skies, short days and hardly any wind, so that solar panels and wind turbines give very little power at the time of year when we need the most of it. It went from energy jargon to news headlines in only a few years.
Most of what gets written about it is about the power system: prices, gas, coal, imports. Here I want to look at the other half, the weather. What did the atmosphere over Europe actually do for these two weeks, and why is it so good at switching off wind and sun at the same time?
How much power went missing
First the size of the problem. Germany has the largest wind fleet in Europe, and the Energy-Charts data from Fraunhofer ISE [1] show the drop clearly:
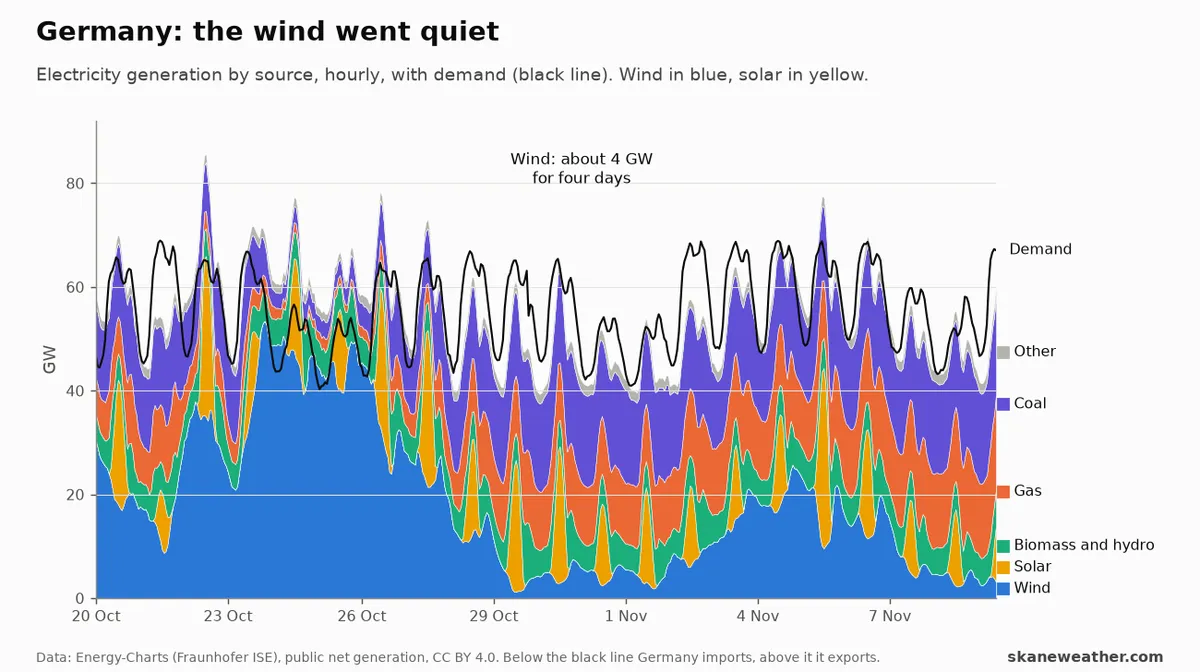 Germany's public net electricity generation by source, hourly, with demand
as the black line. Below the black line Germany imports, above it Germany
exports. Data: Energy-Charts (Fraunhofer ISE) [1].
On 24 October, German wind turbines gave 46 GW averaged over the day, almost as much as the whole country used. Five days later they gave about 4 GW, and they stayed near that for four days. The wind came back for a few days around 4 to 5 November, then dropped away again: 8 and 9 November are as still as the end of October. Solar gave 2 to 8 GW a day, thin yellow spikes around midday, so the gap was filled with 12 to 16 GW of gas and 16 to 18 GW of coal and with imports.
It was not only Germany. Day-ahead prices around the North Sea and the southern Baltic went from almost nothing to several hundred euros per MWh in a couple of days:
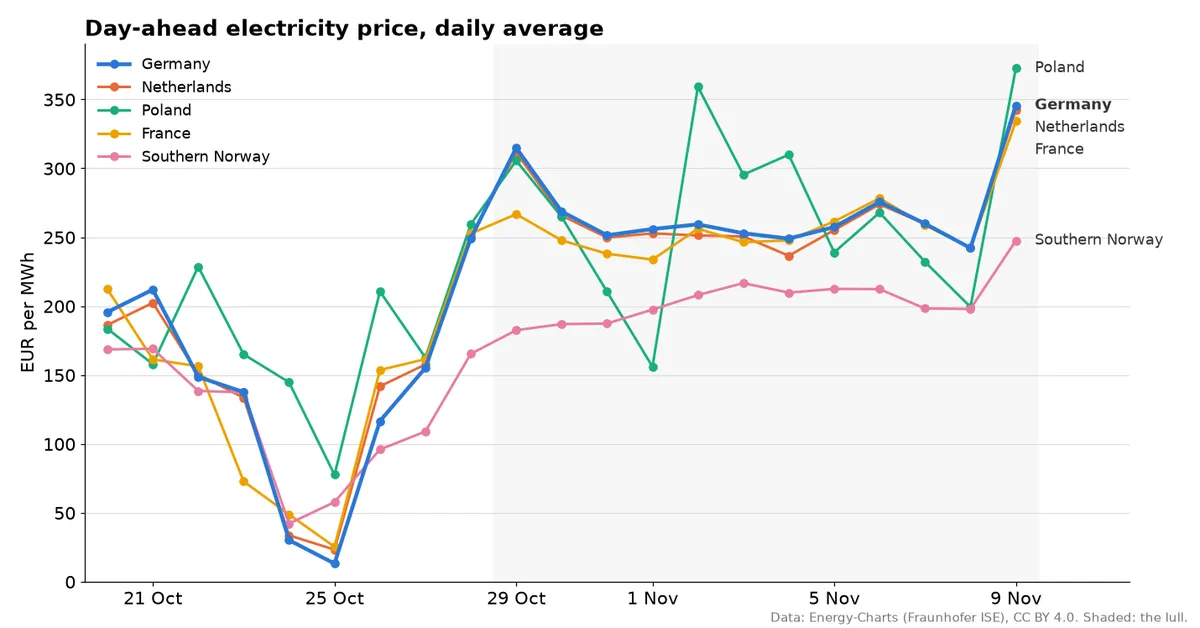 Day-ahead electricity price, daily average, for Germany, the Netherlands,
Poland, France and southern Norway (NO2). The shaded period is the lull, from
29 October. The last point is the price for 9 November, set the day before. Data: Energy-Charts [2].
On the windy days of 24 and 25 October, prices in Germany were 13 to 30 EUR/MWh. During the lull they were 242 to 315, and for 9 November 346. The Netherlands and France moved almost in lockstep with Germany, a sign of how tightly coupled the continental market is when the same weather sits over all of it. Poland, with its coal-heavy system, jumped around more but ended up in the same place. Southern Norway, with its hydropower reservoirs, rose too but stayed 50 to 100 euros below. The shape of those curves is the shape of the weather, so let us look at the weather.
The charts
The maps below are GFS analyses from the Wetterzentrale archive [2]. The colours are the height of the 500 hPa surface, about 5.5 km up, in decametres: blue and green for low heights (cold troughs), orange and red for high heights (warm ridges). The white lines are the pressure at sea level in hPa, which is what sets the wind near the ground. Where the white lines are packed together, it blows. Where they are far apart, it does not.
24 October: the Atlantic is open
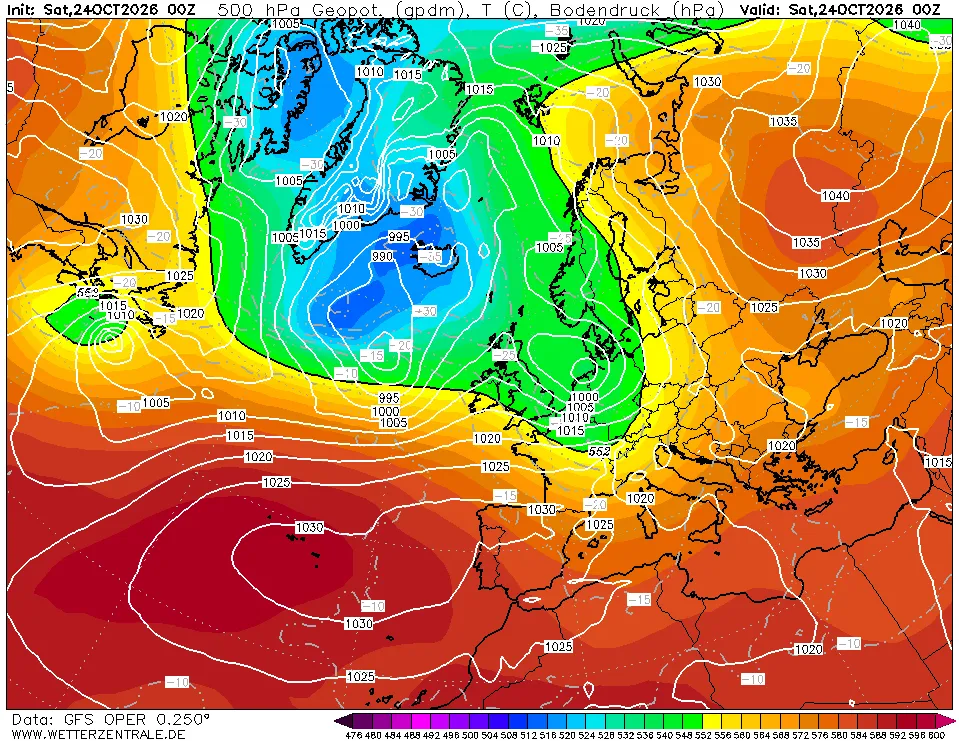 GFS analysis, 00 UTC 24 October 2026. Chart: wetterzentrale.de [2].
This is what a windy autumn day in northwestern Europe looks like. A deep trough sits between Greenland and Iceland, with a surface low near 990 hPa south of Iceland, and the jet stream runs along its southern edge, straight into the British Isles, the North Sea and Scandinavia. The isobars are packed from Scotland to Denmark, and fronts are crossing the North Sea. This is the day German wind peaked at 46 GW.
Note the high over western Russia, above 1040 hPa. It is already blocking the way east. Keep an eye on it.
31 October: the block
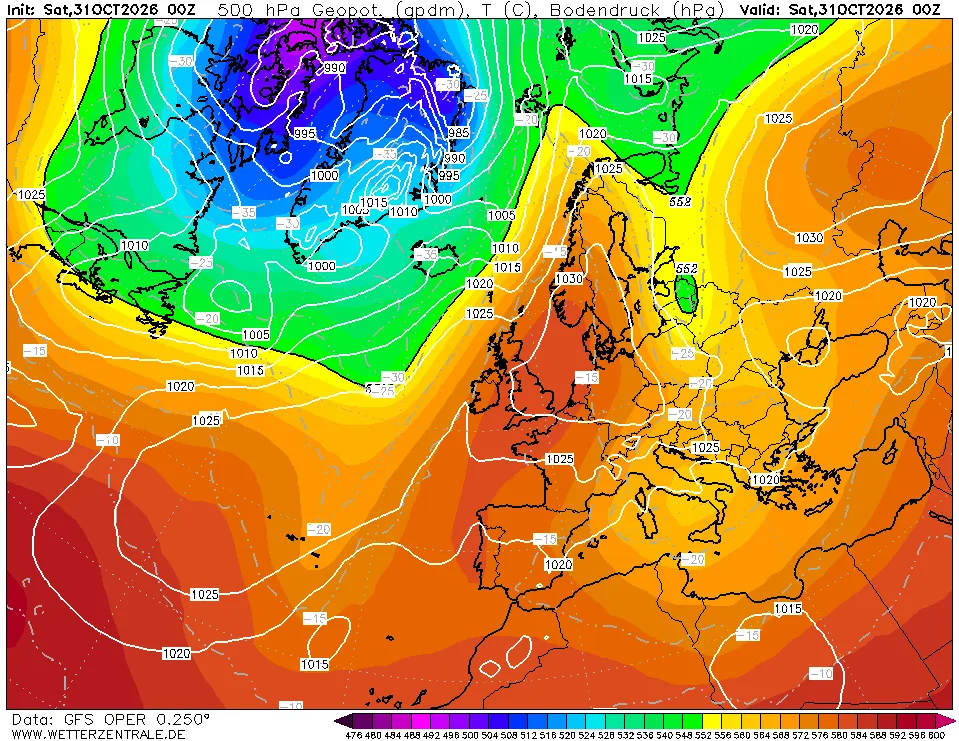 GFS analysis, 00 UTC 31 October 2026. Chart: wetterzentrale.de [2].
A week later the picture has turned around. A ridge has pushed up from Iberia over France, the British Isles and the North Sea all the way to Norway, and at the surface a high of about 1030 hPa sits over the North Sea and southern Scandinavia. The Atlantic lows have not gone anywhere: they are still there, but stuck west of Greenland and over the Arctic, held back by the ridge. Over Germany, Denmark, the Benelux and southern Sweden there are hardly any isobars at all. In the middle of a high like this, there is no wind to speak of.
This is a blocking pattern: a persistent ridge that sits across the normal west to east path of the weather systems and makes them go around it, or stop. Blocks are slow by nature, which is exactly why a dunkelflaute lasts days instead of hours.
6 November: a high to the north, a low to the south
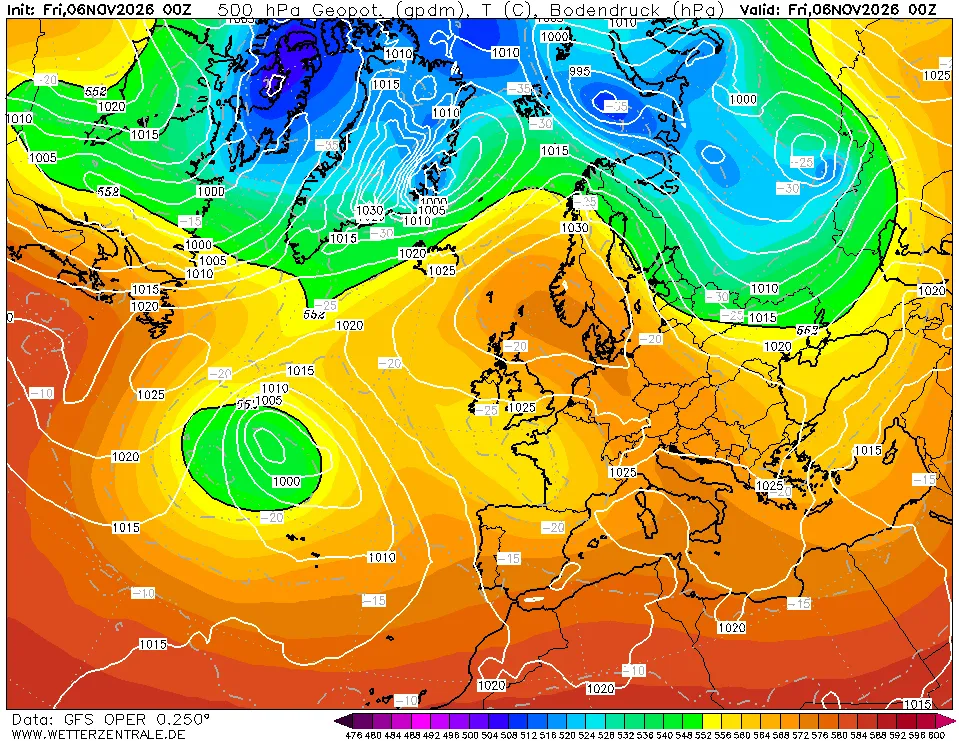 GFS analysis, 00 UTC 6 November 2026. Chart: wetterzentrale.de [2].
In between, the high drifted around. On 2 November it was centred west of Ireland at 1040 hPa, and by 4 November it was over the North Sea. As it moved, the gradient on its flanks tightened for a while, which is when German wind came back for a few days. But the block never broke. By 6 November there is a high over the North Sea and Scandinavia, and a closed upper low has been cut off from the main flow west of Iberia, with the westerlies far to the north. A high to the north and a low to the south is close to a textbook Rex block, one of the most stubborn patterns there is, because the two systems hold each other in place.
9 November: still stuck
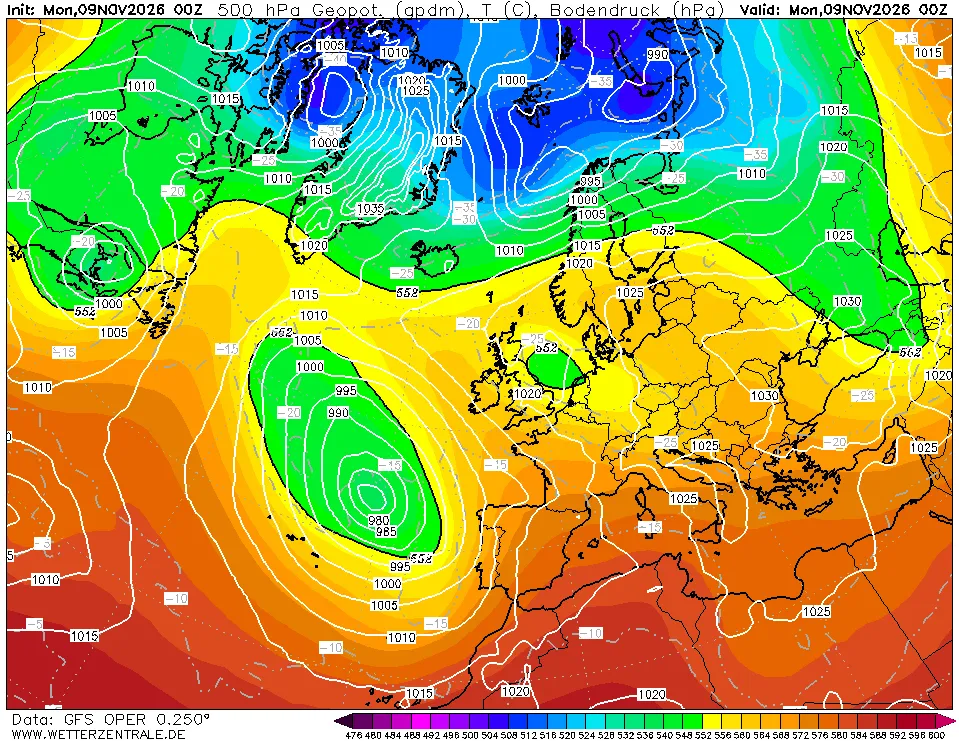 GFS analysis, 00 UTC 9 November 2026. Chart: wetterzentrale.de [2].
This morning the cut-off low west of Portugal has deepened to about 980 hPa at the surface, and a ridge runs from the Azores north towards Greenland, keeping the Atlantic jet away from Europe. Over central and northern Europe there is a broad, flat area of high pressure, 1020 to 1030 hPa, and again very few isobars between the North Sea and Poland. There is a small upper low over the North Sea, but the surface pressure field under it is slack. Not much wind is coming from this.
Why the sky is grey, not blue
A high pressure system usually means sunshine, so why is it dunkel? In summer it would be. In November it often goes the other way. Air sinks inside a high and warms as it is compressed, which creates a temperature inversion a few hundred metres to a kilometre above the ground. Below that lid the air is cool and moist, and with nothing to stir it, it fills with a layer of low stratus that can stay for days. British forecasters have a good name for it: anticyclonic gloom.
Add the season: in early November the sun gets only about 20 to 27 degrees above the horizon at midday across Germany, less further north, and the day is around nine to ten hours long. Under a stratus deck, the solar output of a whole country barely registers. The same weather system removes the wind because the pressure gradient is weak, and the sun because of the cloud it traps. That is the whole trick of a dunkelflaute, and it is why it is so hard for the power system: a block like this covers Germany, the Netherlands, Denmark, Poland and southern Scandinavia at once, so the usual trick of moving wind power from where it blows to where it does not has very little to work with.
A link to the stratosphere?
In my last post I wrote about the polar vortex, which is forecast to have its earliest wind reversal on record this month, around 6 November [3]. It is tempting to connect the two, since a negative NAO and more blocking over northern Europe is the classic surface response to a sudden stratospheric warming. But the timing does not work that way here. The block over the North Sea was in place by 29 to 31 October, before the stratospheric winds reversed, and the surface response to an SSW typically takes one to four weeks to come down [4].
If anything, the arrow may point the other way, at least partly. Tropospheric blocking is a well known precursor of SSWs: blocks, especially over the Euro-Atlantic sector and the Urals, send extra planetary wave energy upward that can knock the vortex over [5]. The big high over western Russia on 24 to 29 October and the block that followed over the North Sea fit that picture. I have not checked the wave fluxes, so I am not claiming more than that. But it is a nice reminder that the stratosphere and the weather near the ground talk in both directions, and that the dunkelflaute and the polar vortex story of the last two weeks may well be two views of the same pattern.
What comes next
The thing that would end the lull is the Atlantic jet coming back over northwestern Europe, or a strong enough gradient on the edge of the high. At the moment the GFS keeps a lot of high pressure over central and northern Europe. If the stratospheric warming does couple down later in November, it would favour more of the same: more blocking, a weaker and more meandering jet, and possibly colder air from the east. For the power system, that is not good news. Cold, still and dark is the combination that tests the system the most.
references
- Fraunhofer ISE, Energy-Charts. Public net electricity generation and day-ahead prices (from ENTSO-E and Nord Pool), CC BY 4.0. https://www.energy-charts.info
- Wetterzentrale, GFS analysis archive (500 hPa geopotential, temperature and sea level pressure). https://www.wetterzentrale.de/reanalysis.php?model=avn
- Is the polar vortex breaking up in November? (this blog, 4 November 2026).
- Baldwin, M. P. et al. (2021). Sudden stratospheric warmings. Rev. Geophys. 59, e2020RG000708. https://doi.org/10.1029/2020RG000708
- Martius, O., Polvani, L. M. and Davies, H. C. (2009). Blocking precursors to stratospheric sudden warming events. Geophys. Res. Lett. 36, L14806. https://doi.org/10.1029/2009GL038776